Contaminated land strategy
Appendix 4 - Risk prioritisation methodology for sites of potentially contaminated land
Stage 1 Risk Assessment and Prioritisation
Potentially contaminated land shall, prior to detailed inspection, be listed and categorized according to a preliminary risk assessment (Stage 1 of The Strategy). The method originally used by the Council, was based on that described in DETR Contaminated Land Research Report 6 –
Prioritisation and Categorisation Procedure for Sites which may be Contaminated (CLR6). This version of The Strategy has not changed this method. To assist in the prioritisation process, a simple scoring system was devised as follows:
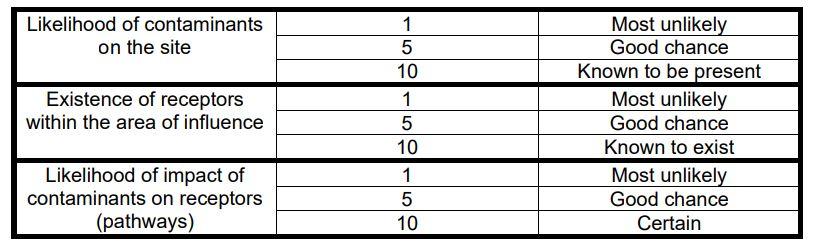
The initial risk assessments within Stage 1 of the Strategy will generate risk priorities that fall into 4 categories:
| Risk Priority Score | Priority Category |
|---|---|
| 26–30 | 1 (High) |
| 21–25 | 2 (Medium/High) |
| 16–20 | 3 (Medium/Low) |
| 0–15 | 4 (Low) |
Priority Category 1 sites are considered a high priority, where the Stage 1 review suggests that the site is not likely to be suitable for its present use or environmental setting, with contaminant(s) probably or certainly present that are likely to have an unacceptable impact on receptors.
Priority Category 2 sites are considered a medium/high priority, where Stage 1 review suggests that the site may not be suitable for present use or environmental setting, with contaminant(s) probably or certainly present that may have an unacceptable impact on receptors.
Priority Category 3 sites are considered a medium/low priority, where Stage 1 review suggests that the site may be suitable for present use or environmental setting, with contaminant(s) that may be present but unlikely to have an unacceptable impact on receptors.
Priority Category 4 sites are considered a low priority, where Stage 1 review suggests that the site is likely suitable for present use or environmental setting, with contaminant(s) that may be present but very unlikely to have an unacceptable impact on receptors.
Very basic examples of how this system is used is demonstrated below.
Example 1: Closed landfill site with houses built on the site with no evidence of site investigation or remediation. Contaminant Score = 10 (Contaminants assumed to be on site) Receptor Score = 10 (Humans living on the site) Pathway Score = 10 (No evidence of gas protection built into houses) Total Score = 30 = Priority Category 1 (High)
Example 2: Closed landfill site with houses built on the perimeter of the site with no evidence of site investigation or remediation. Contaminant Score = 10 (Contaminants assumed to be on site) Receptor Score = 10 (Humans living adjacent to the site) Pathway Score = 6 (Some mitigation provided by surrounding geology & distance) Total Score = 26 = Priority Category 1 (High)
Example 3: Former Town Gas Manufacturing Works with no current land use on site but watercourse adjacent and no evidence of site investigation or remediation. Contaminant Score = 10 (Gas Works contaminants assumed to be on site) Receptor Score = 10 (Controlled Waters adjacent) Pathway Score = 8 (No distance to mitigate migration of contamination) Total Score = 28 = Priority Category 1 (High)
Example 4: Former Town Gas Manufacturing Works with no current land use on site but underlain by a principal aquifer supplying a public drinking water supply, which is overlain by clay drift geology. No evidence of site investigation or remediation. Contaminant Score = 10 (Gas Works contaminants assumed to be on site) Receptor Score = 10 (Controlled Waters & drinking water supply in the vicinity) Pathway Score = 5 (Distance and impermeable geology to mitigate migration of contamination) Total Score = 26 = Priority Category 1 (High)
Example 5: Former Town Gas Manufacturing Works with no current land use on site but underlain by a principal aquifer in a source protection zone 3, which is overlain by clay drift geology. No evidence of site investigation or remediation. Contaminant Score = 10 (Gas Works contaminants assumed to be on site) Receptor Score = 5 (Controlled Waters) Pathway Score = 5 (Distance and impermeable geology to mitigate migration of contamination) Total Score = 20 = Priority Category 3 (Medium/Low)
Example 6: Old power station site, now derelict, no structures, children able to access the site and motorcycles use it for scrambling, with an adjacent river. Contaminant Score = 8 (Contaminants assumed to be on site) Receptor Score = 10 (Human interaction with the site & river adjacent) Pathway Score = 5 (Exposed and disturbed ground creating human exposure pathways. No distance to mitigate migration of contaminants to river) Total Score = 23 = Priority Category 2 (Medium/High)
Example 7: Former quarry pit, now disused and overgrown with no sign of infilling from aerial photographs, located in an area of clay geology, but in an accessible area adjacent to a housing estate. Contaminant Score = 3 (low likelihood of contamination) Receptor Score = 7 (informal human interaction with the site, close to houses) Pathway Score = 3 (exposure to ground limited and impermeable geology preventing any migration from site if contamination were present) Total Score = 13 = Priority Category 4 (Low)